Working with graphs
Januari 8, 2010
Hideki Mori published an article about creating tools for science experiments with/from Scratch. It inspired me to try it myself (I could not wait for the second part of his article). I made a program in Scratch which makes a graphical representation of data obtained from PicoBoard measurements. It is still an untested beta version. The reason that I publish it now, is that I hope that others will suggest improvements or make comments. The purpose of this forum is exchanging ideas and inspiring each other.
I am aware of the fact that it would be better if children create their own program (like Hideki did). But I would like to use this program instead of another (commercial) program, which gives much more accurate graphs, but which allows the use of only one sensor. With the PicoBoard/Scratch combination I can use four sensors.
My program is only useful for measurements of "slow changes". You can choose the measurement time and the sampling interval. But if the sampling interval is rather short, the measurement will take much more time than is chosen:
Chosen measurement time: 10 seconds
Sampling interval time: 0.01 seconds
Real measurement time: 50.8 seconds!
But to be honest, 0.01 seconds is a very short sampling interval. With measurements wich take much more time, for instance when measuring temperature changes, this shortcoming is no problem.
I ordered some NTC resistors and will make a temperature version of this program. This one is for use with opto sensors.
But perhaps the second part of Hideki's article makes my programs superfluous ;-)
Januari 10, 2010
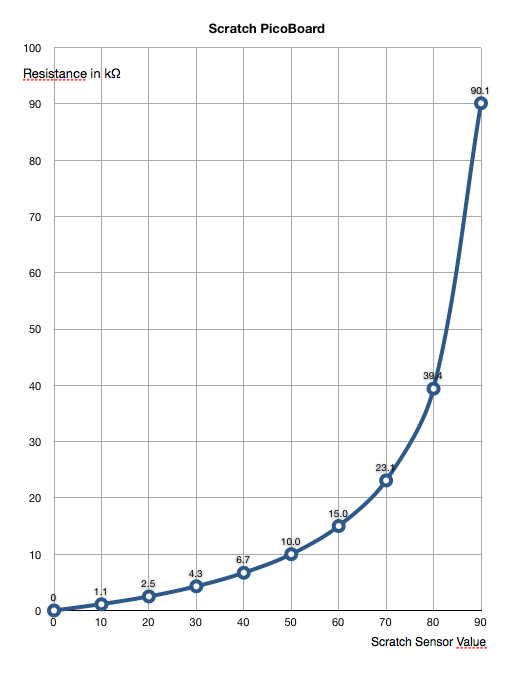
I added an image of a graph which represents the relation between the measured resistance (PicoBoard) and the corresponding sensor value in Scratch.
Niceee.... I've built a guitar with 4 strings and tried connecting it to the Scratch board.
The resistance circuits didn't help, so I tried the noise sensor.
That's when I used graphs that marked the guitars volume.
I couldn't manage to deferent between the chords. Scratch is too weak for DSP.
But it was interesting experiment...
This is so useful -- thanks for sharing!